Key takeaways
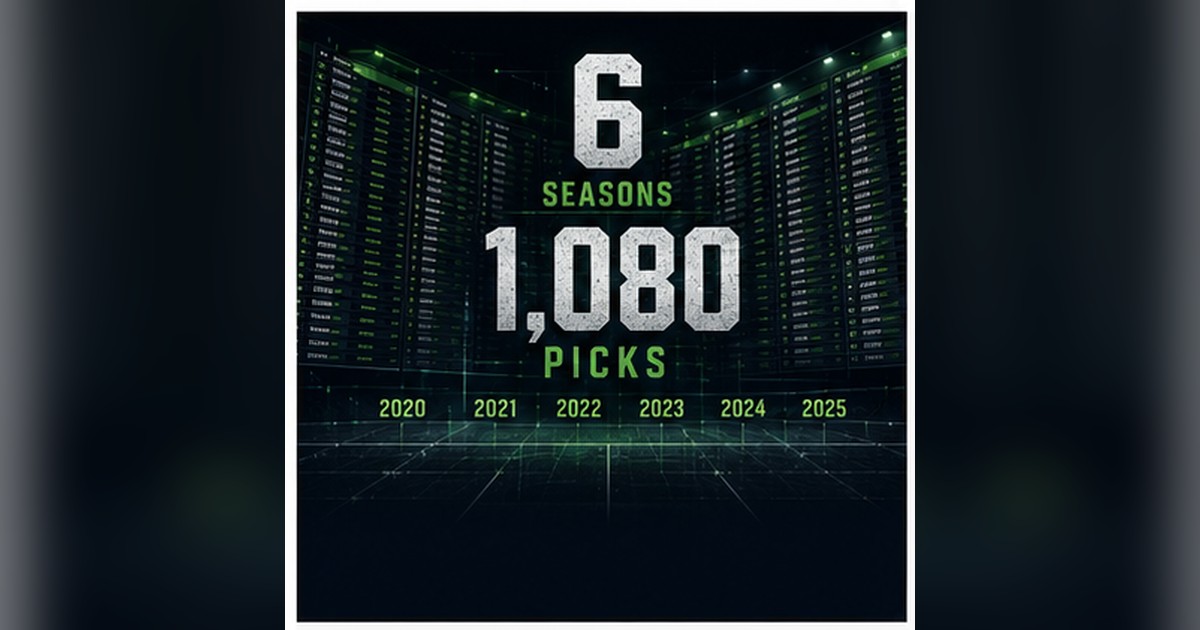
- Six seasons, 1,080 picks, one league. The ITFFL draft data runs 2020 through 2025: 12 teams every year, 22 different managers, and every pick Sleeper recorded.
- The format does half the arguing for you. Full PPR, three REC_FLEX spots, a mandatory K and DEF, six bench spots, and no keepers in any of the six seasons. Every draft started from zero.
- Round 1 is a running back room. 40 of 72 first-round picks were RBs. By round 3 the board flips hard: 38 WRs to 19 RBs.
- The draft got shorter. 16 rounds and 192 picks in 2020-2022, 14 rounds and 168 picks from 2023 on. Raw pick numbers do not compare across that line.
- The best regular-season manager in league history has zero titles. End Of Story averages a 4.50 finish across six seasons and has never won it. That contradiction is most of this series.
Every August this league has the same six arguments. Somebody says you can't win from the turn. Somebody says you have to get your QB early now. Somebody brings up the round 8 kicker again. And every year the argument is settled by whoever talks loudest, because nobody has ever gone and looked.
So we looked. Six complete ITFFL seasons of draft data, 2020 through 2025, straight out of Sleeper. 12 teams a year. 1,080 total picks. 22 different managers have sat in this league at some point, seven of them for all six years. Six champions, and six regular-season standings that mostly disagree with those champions about who was good.
This is the opener for a series that works through the whole thing, one argument at a time. No vibes, no ADP from some national site that has never met this league. Just what actually happened on this board, in these drafts, with these people.
What the ITFFL draft data actually covers
The set is complete and it is small, and both halves of that matter. Complete means no gaps: every round, every slot, every season from 2020 to 2025, plus final regular-season standings and the champion each year. Small means twelve teams times six seasons, which is 72 team-seasons. That is a real dataset for a fantasy league and a laughably tiny one for statistics. We will keep saying that.
One structural thing changed midway. From 2020 through 2022 the draft ran 16 rounds, 192 picks. From 2023 on it has been 14 rounds, 168 picks. So a pick at 135 overall in 2020 is not the same animal as a pick at 135 overall in 2024, because in 2020 there were 57 picks left after it and in 2024 there were 33. Anywhere in this series where we compare draft timing, we compare by round or by picks-from-the-end, never by raw overall number.
The format is doing more work than you think
Before any of the findings make sense, the settings have to be on the table. ITFFL starts QB, RB, RB, three REC_FLEX, K and DEF. Six bench spots. Fourteen roster slots total. Scoring is full PPR. Eight of twelve teams make the playoffs.
Read that lineup again, because it explains the shape of every draft in the sample. Three REC_FLEX spots in full PPR means a starting lineup can be five pass-catchers deep and only two of them have to be running backs. There is no forced TE. There is no second QB. The only truly scarce required starters are the two RB slots, and everything else is a market you can attack from a lot of directions.
And there were no keepers in any of the six seasons. That is the part that makes this data unusually clean. Nobody entered a draft holding a discounted star. Nobody punted a year for next year's roster. Every board in this sample was built from an empty roster by a manager making live choices, which means the tendencies you see are preferences, not carryover obligations.
Eight of twelve teams make the playoffs. In a league where two thirds of the field gets in, the regular season is not a filter, it is a warm-up. That single setting is why "best manager" and "most trophies" are two different lists here.
Round by round, the league has a very clear shape
Pool all 1,080 picks and the league's collective personality shows up immediately.
- Round 1 is running backs. 40 RBs, 29 WRs, 2 QBs, 1 TE out of 72 picks.
- Round 2 stays there. 34 RBs, 28 WRs.
- Round 3 flips. 38 WRs to 19 RBs. Two-to-one the other direction, in one round.
- Round 5 is peak QB. 14 quarterbacks, more than any other round in the sample.
- Round 11 is when defenses arrive. 13 DEFs and 7 Ks, the first round where non-skill picks outnumber tight ends.
- Round 14 is the K/DEF round. 20 DEFs and 15 Ks out of 72.
That round 2 to round 3 flip is the single most consistent behavior in six years of ITFFL drafting. The league treats the first 24 picks as a running back run and then pivots to receivers essentially in unison. Whether that is correct in a full PPR league with three flex spots is exactly the kind of thing worth arguing about, and it is a lot easier to argue about with the actual counts in front of you.
The four arguments this series settles
Here is what is coming, and why you are going to want to read all of it.
The kicker thing is not what you think it is. One manager took the league's first kicker in four of the six seasons, including one in round 8 that we will be discussing for the rest of our lives. That manager also has the best average finish of anybody who has played all six years. The lazy version of this take is wrong and the true version is funnier. The full breakdown of the kicker paradox is here.
Early QB has a suspicious split. The first quarterback off the board has gone in the first two rounds in five of the six seasons, so this is a league that reaches. The managers who did the reaching finished 4th and 2nd in the first two years of the sample, then 9th, 7th, 12th and 7th in the four years since. Six data points, one league, and a pattern nobody in the group chat has mentioned. That is its own post.
The draft slot question has an answer, sort of. Averaged over six seasons, four slots have been noticeably worse than the other eight, and one of them is the first overall pick, which sits at an 8.33 average finish. Before you start lobbying the commissioner: that is six data points, and one of those six won the regular season outright. We take the slot argument apart properly here.
Best manager and most trophies are different people. Six titles have gone to five different managers. Only one of those six champions also finished first in the regular season. One won it from eighth place at 5-8. Meanwhile the manager with the best six-year average finish in league history has never held the trophy, and a 13-0 season did not win one either. That comparison gets its own post, and so does the broader problem that the regular season here is close to a lie.
What six seasons cannot tell you
The honest disclaimer, up front, so nobody has to pretend later. Every per-slot number in this series rests on six observations. Every per-manager number rests on somewhere between one and six seasons. A manager with one season in the book has an average finish that is just that one finish, and we are not going to build an argument on it.
Nothing here establishes cause. When we write that the teams that did X finished around Y, that is the sentence, and it is not the same sentence as X causes Y. Fantasy football over 14 games is loud, injuries are random, and a two-point Monday night swing has rearranged this league's standings more than once. Six seasons of a twelve-team league can tell you what your friends actually do on draft night. It cannot tell you what the universe requires.
The pick'em angle: drafting is just a slower pick'em
Draft night and a weekly pick'em pool are the same exercise at different speeds. Both are a sequence of forced choices under uncertainty, both punish the person who never reviews their own history, and in both the edge belongs to whoever noticed a pattern first. The manager who knows the league pivots to receivers in round 3 can sit on a running back one extra pick. The pick'em player who knows they are 4-11 taking home road favorites can stop doing it.
The tools work the same way on both sides. Pull up your own history on the statistics page, see where you have actually been strong instead of where you remember being strong, and take that into your draft prep. Then check the leaderboard to see who in this group is quietly better at this than they let on. It is usually not the loudest one.
Next up in the series is the kicker post, because it is the one everybody thinks they already know the answer to and it is the one where the data most clearly says otherwise. After that: early quarterbacks, the draft slot fight, the trophy-versus-talent argument, this league's strange relationship with rookies, and eventually the all-time record book, which contains at least two numbers that are going to start fights.
Six seasons in, this league finally has receipts. Draft season starts now, and for the first time it starts with everybody looking at the same board.